TRACERS Public Data Access
For a decription of TRACERS Level 2 data products please see the Main Site, otherwise select one of the options above to access and download files.
To understand the various coordinate systems in which these data are presented see the TRACERS Coordinate System Definitions document.
TRACERS Level 2 CDF Files
L2s are the lowest level data products available to the scientific community consisting of calibrated data in spacecraft and geophysical coordinates with ephemeris and attitude data. Refer to the TRACERS Rules of Use while working with these data products.
ACE Level 2 Data

The ACE L2 data consist of raw measured counts and calibrated differential energy fluxes as a function of anode angle and calibrated energy. Counts are accumulated in 21 discrete anodes with different viewing angles for each of 49 energy steps, with a basic measurement cadence of 50 ms. Counts are converted to differential energy flux by subtracting an estimate of the background and then dividing by the instrument calibration matrix. The estimated background count rates and calibration matrix are included in the L2 data files, enabling application of alternative background subtraction methods or calibrations.
Background estimates include two sources:
- Instrumental background due to electronics crosstalk, which is constant across all anodes but varies with energy.
- Natural background due to penetrating energetic particles and natural radioactivity in the microchannel plate detectors, which is constant across all anodes and energies.
NOTE: The ACE instrument was intended to be operated in a particular spacecraft orientation, with the TSCS +Z axis aligned with the magnetic field. In this orientation, incoming electron trajectories are not occluded by the spacecraft. However, for a portion of the TRACERS mission, the spacecraft are oriented in the opposite sense, which leads to an occlusion of a portion of the instrument field of view by the spacecraft body for low-energy (<~200 eV) electrons. Low-energy ACE data should not be utilized for quantitative purposes when the spacecraft are in this orientation.
More details are available in the ACE Instrument Paper.
ACI Level 2 Data

ACI is a toroidal top-hat electrostatic analyzer on a spinning platform that provides full angular coverage with instantaneous 22.5 degrees x approximately 6 degrees angular resolution for a single energy step. ACI covers an ion energy range from approximately 8 eV/e to 20,000 eV/e in 47 logarithmically spaced energy steps with a fractional energy resolution of approximately 10%. It provides reasonably high-cadence (312 ms) measurements of ion flux and energy-dependent pitch angle distributions with a 5-order-of-magnitude sensitivity, enabling detection of cusp boundaries and characterization of cusp ion steps.
The ACI L2 data consists of differential energy flux as a function of epoch, energy (47 bins), and look angle (16 directions). In addition, errors in the differential energy flux are provided. Finally, the differential energy flux is ordered by pitch angle. Pre-environmental calibration of both ACI units involved determining instrument response factors, such as MCP Gain, discriminator thresholds, and energy and solid-angle coverage and resolution. Unfortunately, not all the updates from the on-ground testing were applied in flight from the start of the mission, and changes to settings were in place by 1/15/2026. Work is ongoing to characterize the differences in the gain/counting between the 2 instruments to allow for more direct comparisons; however, we are aware of differences between the units of at least a factor of 2.
NOTE: The uncertainty in the absolute fluxes is large (on the order of a factor of 2 or more). Please consult with the ACI team for further direction.
More details are available in the ACI Instrument Paper.
EFI Level 2 Data
Please see the EFI Instrument Paper for details.
MAG Level 2 Data
Please see the MAG Instrument Paper for details.
MSC Level 2 Data
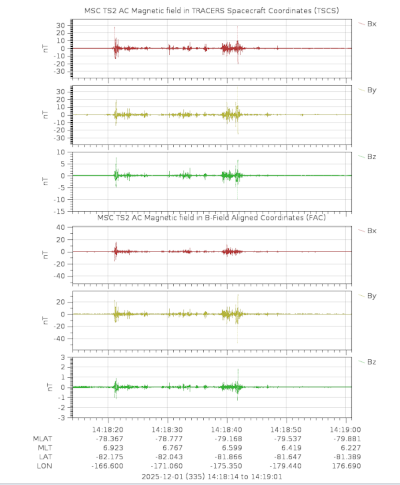
Level-2 (L2) MSC data products are the 3-axis waveforms sampled at 2048 samples per second and calibrated at 100 Hz for amplitude. The data are available in the CDFs with TSCS (spacecraft) coordinates and field aligned coordinates (FAC). See left Figure for an example of the MSC L2 data.
L2 Waveform data is amplitude-calibrated at 100 Hz. There are amplitude deviations at other frequencies, and there are phase shifts which are not reflected in the L2 data at all. The phase shift is a frequency-dependent shift in the phase of the observed wave relative to the input wave, tantamount to a time delay at that frequency. The L2 data can be adjusted over frequency by applying dimensionless complex factors over frequency immediately after Fourier transforming the L2 data. The Variable " ts2_cal_freq_response" in the CDF consists of a table for the MSC sensor. Each table has 16384 entries. The Variables are "frequency" (contains the associated frequencies of the calibration coefficients); "real" (the real component of the calibration); "imaginary" (the imaginary component of the calibration), and "magnitude" (the gain factor difference for that frequency compared to 100 Hz). The values extend from 0.0625 Hz to 1024 Hz, in steps of 0.0625 Hz. The table is constructed assuming 32768 data points are to be FFT'ed. If fewer than that are to be transformed, then the table can be decimated to accommodate a shorter data set. The procedure is; FFT the L2 data at the desired resolution and then perform a complex division of the FFT'ed dataset with the MSC calibration table.
Field Aligned Coordinates (FAC) Note: If the FAC data are missing for a period in a MSC L2 CDF, we are currently lacking the definitive spacecraft orientation data for that period which is needed to produce the FAC data. These MSC L2 CDFs will be updated as we obtain sufficent attitude information.
Calibration Note: All L2 Waveform products are calibrated in amplitude at 100 Hz only. There is no phase calibration applied at this stage. Before using these waveforms to process wave parameters, or to produce fully calibrated spectrograms, please follow the calibration process described above.
More details are available in the MSC Instrument Paper.
MAGIC Demostration, Level 2 Data
MAGIC Level 2 data products consist of 3-axis magnetic field measurements sampled at 128 samples per second in the Region of Interest (ROI) and 16 samples per second during back orbit operation. The CDFs of these data provide MAGIC as measured in its own instrument frame, de-spun into the GEI2000 reference coordinate system, and the North-East-Center (NEC) coordinate system.
Gap Note: Data gaps are present in the current Level 2 magnetic fields data pertaining to lack of definitive spacecraft attitude needed to produce reliably de-spun data. MAGIC Level 2 CDFs will update as more definitive spacecraft attitude data is provided.
Calibration: Level 2 data products regress the original sensor data against the scalar magnitude of a reference field, IGRF, using least squares techniques. This regression, at a minimum, provides a 9 factor (sensitivity, orthogonality correction, and offsets) of the three magnetometer axes, which provides a basis for rotating into other desired coordinate systems. We use extended scalar-vector formulae to correct for per-axis non-linear response, cross-axis sensor feedback, and temperature dependence of the sensor response. Data used for the scalar-vector calibrations are sampled during eclipsed periods, which avoids stray signals from the solar cells. Alongside the three coordinate systems provided as described above, a data quality flag is also provided. Time periods marked as a '1' have been contaminated by the satellite magneto-torquers with no attempt to remove these signals in the data, '2' indicates there is no definitive kernel attitude for this time range, and '3' is a combination of no definitive attitude and magneto-torquer operations. All other data should be marked as '0' but the data quality flags may extend to other values as the mission progresses.
More details are available in the MAGIC Demonstration Paper.
TRACERS Level 3 CDF Files
L3s provide more refined datasets which typically include contributions from multiple instruments.
ACE Level 2 DataACE Level 3 Data
ACE pitch-angle data overview in progress